Why Mark Sanford won in SC

As you may know, Mark Sanford won the 1st congressional district seat in South Carolina a few days ago. While the media has focused on his fall from grace and that he was heavily fined for using state travel funds to finance a tryst in South America, I looked behind the scenes and find the real reason for his success.
Simply put, as I’ve written about many times before, he is a Republican running in a Republican district. It has voted Republican since 1980, over 32 years . He could have been almost anyone, and would still have won the general election.
The real election was the primary, where 13 Republican challengers all fought for the win. That’s the real race; the actual elections are mostly coronations in spite of what the public thinks. So the relatively few people who vote in the primaries (and runoffs) are the ones who decide the winners.
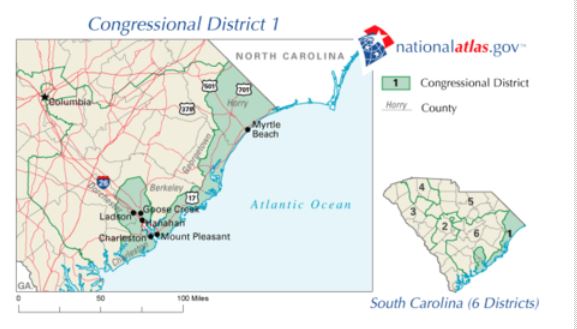
The Democrats were wasting their time and money. It was a done deal that a Republican would continue to win forever. Why? Because the 1st district is the coastal area of South Carolina. That means wealthy and Republican.
You can see from this tabulation how easy it was for Republicans to win every cycle. In this 2013 election, there were 13 Republican challengers, but only 53,793 votes cast in the primary. Mark Sanford and Curtis Bostic had a runoff as neither won an outright plurality. Only 46,171 voters decided the runoff choosing Mark Sanford.
I’m not bashing Republicans, as I am one. I could tell the same story for historically Democrat districts where Republicans don’t have a chance. In the last election cycle, the Democrats didn’t even bother to run a challenger against Speaker John Boehner, a thorn in President Obama’s side, as they knew it was hopeless!
Next year, my race will be decided at the primary as there will be plenty of challengers. It will be followed by a runoff, and if I can raise enough money I will win. It’s all about being known to the voters. That’s all that matters.
| SC election results | |||||
| Year | Winner | Party | Total votes | Winning percentage | |
| 1980 | Thomas Hartnett | Republican | 158,961 | 51.60% | |
| 1982 | Thomas Hartnett | Republican | 117,687 | 54.30% | |
| 1984 | Thomas Hartnett | Republican | 167,313 | 61.70% | |
| 1986 | Thomas Hartnett | Republican | 115,242 | 52.00% | |
| 1988 | Arthur Ravenel | Republican | 159,305 | 63.80% | |
| 1990 | Arthur Ravenel | Republican | 123,506 | 65.50% | |
| 1992 | Arthur Ravenel | Republican | 184,549 | 66.10% | |
| 1994 | Mark Sanford | Republican | 147,471 | 66.30% | |
| 1996 | Mark Sanford | Republican | 143,693 | 96.40% | |
| 1998 | Mark Sanford | Republican | 130,071 | 91.00% | |
| 2000 | Henry Brown | Republican | 231,446 | 60.30% | |
| 2002 | Henry Brown | Republican | 142,425 | 89.56% | |
| 2004 | Henry Brown | Republican | 212,308 | 87.82% | |
| 2006 | Henry Brown | Republican | 193,375 | 59.87% | |
| 2008 | Henry Brown | Republican | 341,879 | 51.93% | |
| 2010 | Henry Brown | Republican | 233,695 | 65.37% | |
| 2012 | Tim Scott | Republican | 290,013 | 62.03% | |
| 2013 | Mark Sanford | Republican | 142,976 | 54.04% | |