So you think 24% GDP growth since 2000 is good? It isn’t.
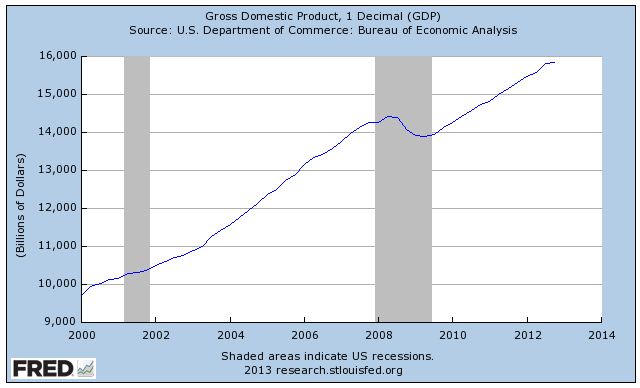
If you look at this Federal Reserve graph, you’ll be pleased that our Gross Domestic Product, GDP, is growing rapidly. So in spite of our economic troubles, the country is doing well. Between the year’s 2000 and 2012, it grew from $11.03 trillion in 2000 to $13.65 trillion in 2012. That’s a 23.7% increase in twelve years! Very nice, or so you think. It isn’t.
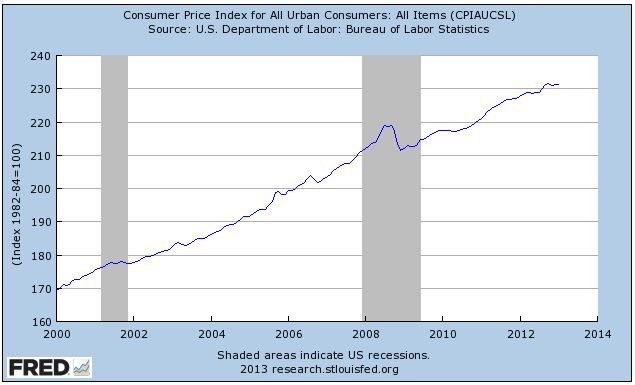
What isn’t so nice is that we’ve had steady inflation. The Consumer Price Index has increased from 169.3 in January 2000 to 231.2 in 2012. That’s a 37% increase.
So what appears to be a successful 12 years, actually shows a decline of 13%. In other words, inflation has outstripped productivity.
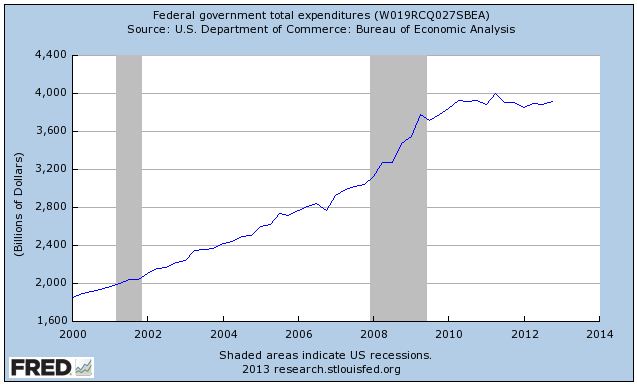
This last chart is the worst. It shows how much money the federal government is spending over the same period. They spent $1.857 trillion in 2000 and over $3.915 trillion last year. That’s an increase of 111%, with a tax cut, two wars and much of it borrowed!
Is it any wonder that we’re in trouble?

